

When generation falls below plan, your team needs to know whether the gap comes from weather, an operating loss, or the model itself. A production chart cannot answer that question on its own. The quality of the benchmark determines the quality of the diagnosis.
Denowatts uses the Deno Digital Twin Benchmark (DTB) to connect site measurements and a solar energy model to a continuous Expected Energy reference. Here is how the system works, why its approach differs from a traditional weather station workflow, and what that distinction means for performance analytics.
Key Takeaways: Digital Twin Benchmarking for Solar Performance
- Expected Energy uses actual site conditions to estimate what a modeled PV asset should generate during a given period.
- Traditional weather stations supply environmental measurements; Deno DTB combines purpose-built measurement with a continuously managed energy benchmark.
- Denowatts connects wireless, self-powered sensors with physics-based models to make production and loss analysis more actionable.
- Comparing measured generation with Expected Energy helps separate weather variation from potential operating and modeling issues.
- Measurement quality, model assumptions, and data completeness still require scrutiny before a performance gap becomes an O&M decision.
What Is the Deno Digital Twin Benchmark?
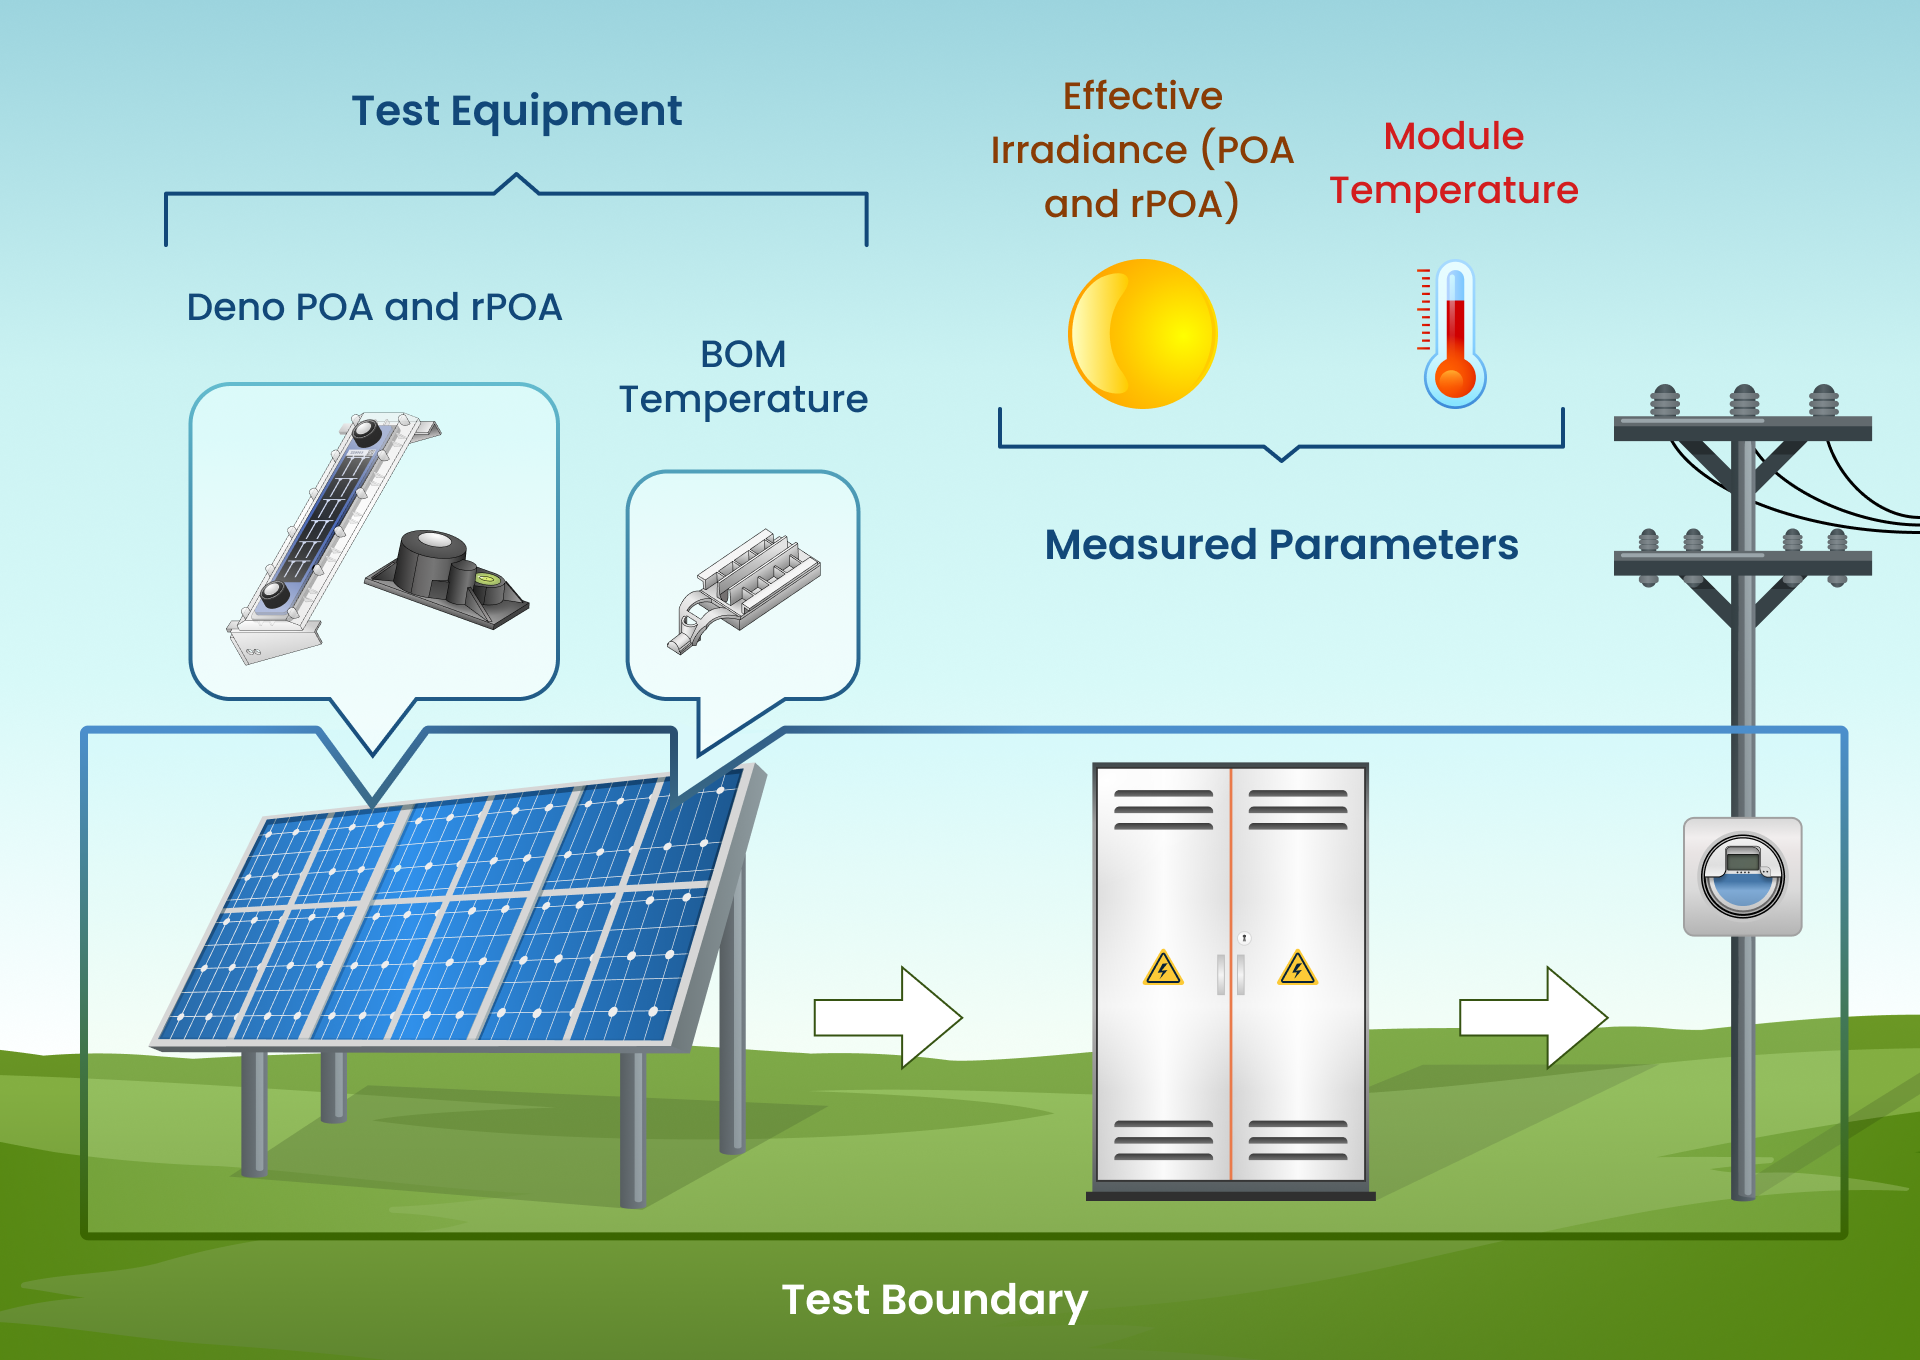
The Deno Digital Twin Benchmark (DTB) models how a PV asset should perform under current site conditions. The Deno sensor system measures effective irradiance and module temperature in the plane of array; the site model converts those inputs into Expected Energy. Denowatts describes a physics-based lifecycle model built on pvlib.
That reference has a different job from a P50 prediction. A prediction reflects modeled output under a typical meteorological year; Expected Energy reflects the weather actually experienced during the reporting period. Denowatts' explanation of Predicted and Expected Energy makes the distinction useful for both financial and electrical-performance questions.
Denowatts also offers model management and energy accounting alongside benchmarking. The choice of service matters: sensor measurements alone and full plant loss analysis are different deliverables.
Why Use Deno DTB Instead of a Traditional Weather Station?
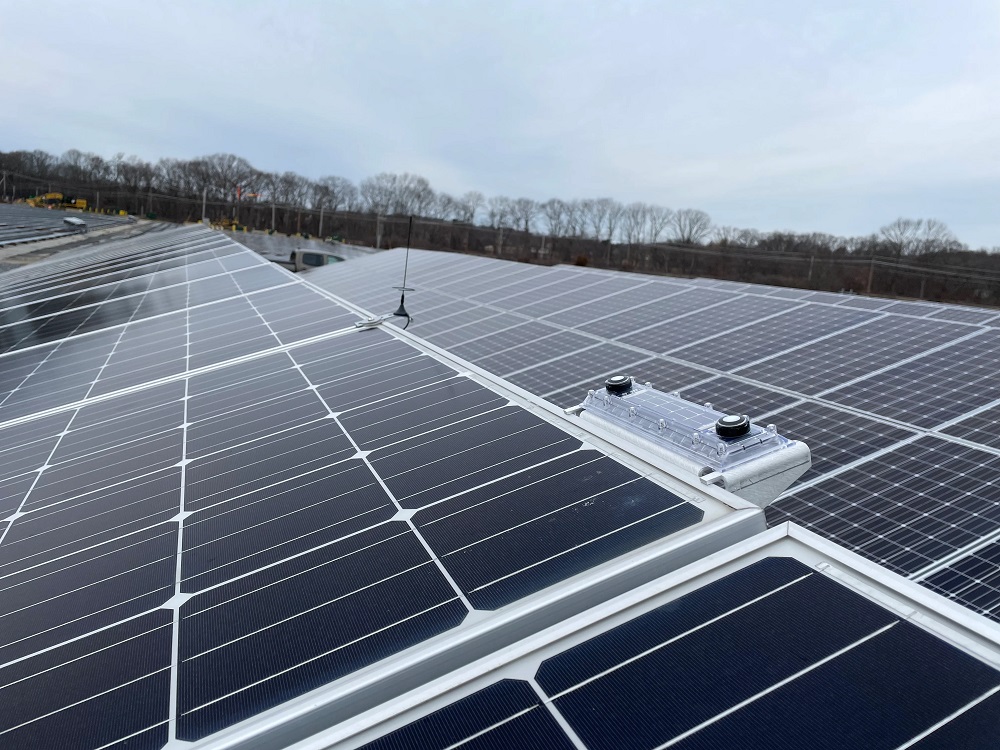
A traditional weather station measures environmental conditions that analysts can use in an energy model. Deno DTB is designed around the performance benchmark itself: purpose-built, wireless, self-powered sensors measure effective irradiance and module temperature, while the modeling workflow produces an ongoing Expected Energy reference. This reduces the handoff between resource measurement and performance analysis.
Denowatts' digital twin explanation describes the Deno Simulator as mounted in the plane of array and computing real-time Expected Energy from an initial energy model. That lets an engineer ask what the array should be producing under observed conditions, rather than starting with a weather data export and a separate reconciliation exercise.
The distinction is about workflow and measurement fit, not a blanket claim that weather stations cannot work. Site contracts, required meteorological variables, instrumentation coverage, and existing data systems still determine the right configuration. DNV's technical review of Denowatts' methodology considered its suitability as a traditional weather station alternative, including effective irradiance, test boundaries, and long-term benchmarking.
How Does a Digital Twin Improve Performance Analytics?
An Expected Energy reference gives measured generation a meaningful comparator. A shortfall can be examined against actual irradiance, temperature, equipment data, and model assumptions instead of being attributed immediately to a failed component. The benchmark makes the question specific: how much of the observed gap is attributable to operating conditions, and how much warrants investigation?
Denowatts' performance metrics guide distinguishes Expected Energy, measured generation, and unavailable energy. Those distinctions help asset teams separate periods of equipment outage from production during normal service. Check sensor placement, calibration, time alignment, missing measurements, and the applicable model before assigning a cause to a deviation.
Where Denowatts' Energy Accounting service is used, the benchmark supports real-time production and loss analysis. Its energy accounting guidance connects these measures to IEC 61724-series reporting principles. The benefit is a more consistent basis for investigating losses across assets, rather than an automatic root-cause verdict from a single KPI.
What Changes for Asset Managers and Performance Engineers?
For O&M teams, a persistent gap between measured generation and Expected Energy can help prioritize which asset deserves investigation. A transient weather-driven change may not require the same response. The benchmark helps direct attention, but engineers still need equipment telemetry and site context to confirm a fault.
For asset managers, consistent assumptions and documented measurements make performance reporting easier to examine and defend. Denowatts' ISO/IEC 17025:2017 accredited calibration and testing scope is relevant here; its capacity testing announcement also identifies ASTM E2848 and IEC 61724-2 methods. Accreditation for calibration or capacity testing should not be mistaken for accreditation of every analytics conclusion.
Model review matters over an asset's life. If predictions and operating results keep diverging, revisit assumptions before treating every variance as lost generation. Research on PV fleet aging and weather effects illustrates why long-term performance trends require careful treatment of operating conditions and data quality.
Make the Benchmark Part of the Analysis
Deno DTB brings measurement and a physics-based Expected Energy reference into the same performance workflow. That matters because production data becomes more useful when the comparison reflects current site conditions and a model whose assumptions can be examined.
Use the benchmark to focus loss investigations, test model assumptions, and communicate performance with a clear measurement basis. Keep the limitations visible: site configuration, calibration scope, and data quality determine how much confidence any specific conclusion deserves.
FAQs About Deno Digital Twin Benchmarking
What does Deno DTB measure?
Deno sensors measure conditions including effective irradiance and module temperature. Denowatts combines site measurements with an energy model to calculate Expected Energy, which provides a reference for assessing actual PV generation.
How is Deno DTB different from a weather station?
A weather station supplies environmental measurements for downstream analysis. Denowatts' Deno DTB couples purpose-built measurements with a continuously calculated Expected Energy benchmark. Site requirements may still call for a weather station or additional instruments.
Can a digital twin identify the cause of every loss?
No. Denowatts' Expected Energy benchmark helps identify when actual production diverges from modeled production. Engineers still examine equipment telemetry, sensor quality, operating status, and site conditions to establish a defensible root cause.
Why does benchmark quality matter to reporting?
An inaccurate reference can misstate the size or timing of a performance gap. Denowatts' calibrated measurement approach and documented testing methods support more traceable analysis, while the reporting team remains responsible for checking model assumptions and data completeness.

Comments
0